
Too Long? Read This First
- A WhatsApp chatbot can run perfectly and still quietly lose most of its contacts partway through the flow. Without the right numbers, that leak stays invisible.
- Completion rate, drop-off rate, and reassignment rate turn "something feels off" into a specific, fixable problem.
- Wati's Chatbot Analytics update comes up with metrics that help you get a complete idea. It lets you drop into the exact node losing contacts, and read the real conversations that stalled there.
- Every chatbot save creates a new version, so you can fix a flow and measure the before-and-after against the exact version that had the problem.
WhatsApp chatbot that never throws an error can still be leaking leads. That's chatbot drop-off, and it's exactly what Wati's Chatbot Analytics is built to expose.
A WhatsApp chatbot can send every message correctly and still fail the business.
It answers on time, follows the flow logic, and never throws an error and it can still lose most of the contacts who start a conversation with it, silently, at a step nobody is watching.
This guide shows how to read those numbers, find the exact leak, and fix it.
Why "The Bot Works Fine" is Exactly the Problem
A WhatsApp chatbot can send every message correctly and never throw an error, and still fail the business. It can lose most of the contacts who start a conversation with it, silently, at a step nobody is watching.
That risk is only growing with the channel: WhatsApp set a new all-time record of more than 29 million messages sent per second during the 2026 FIFA World Cup Round of 16, and broke that record again during the final at over 30 million messages per second.
At that scale, a broken step in a business's automated flow does not fail quietly for a handful of people. It fails for everyone who hits it.
That silence is the real cost. A contact who drops off doesn't file a complaint; they simply stop replying, and without the right numbers, that contact looks identical to one who successfully completed the flow. Multiply that across every contact who enters the flow, and one broken step can quietly turn a large share of inbound leads into dead ends.
The stakes of getting this wrong keep rising, too: 78% of consumers say a single poor interaction would make them consider switching brands, up from 67% just a year earlier. A contact stuck at a dead-end node is exactly this kind of poor interaction, and it's happening at a scale most teams cannot see.
"Is my chatbot working?" is the wrong question. The right one is: how many sessions complete, how many don't, and at which exact step do they stop? Without those numbers, a leaking bot and a healthy bot look identical from the outside. That's precisely why Wati built Chatbot Analytics.
The Chatbot Analytics Dashboard at Wati: One Account-Wide View of Every Bot
Until now, the only chatbot metric Wati gave customers was a single number: total automations executed.
Admins had no way to see how many sessions a bot handled, how many contacts finished the flow, where people dropped off, or what happened in any individual conversation. Debugging a bot meant guessing or raising a support ticket.
Chatbot Analytics closes that gap.
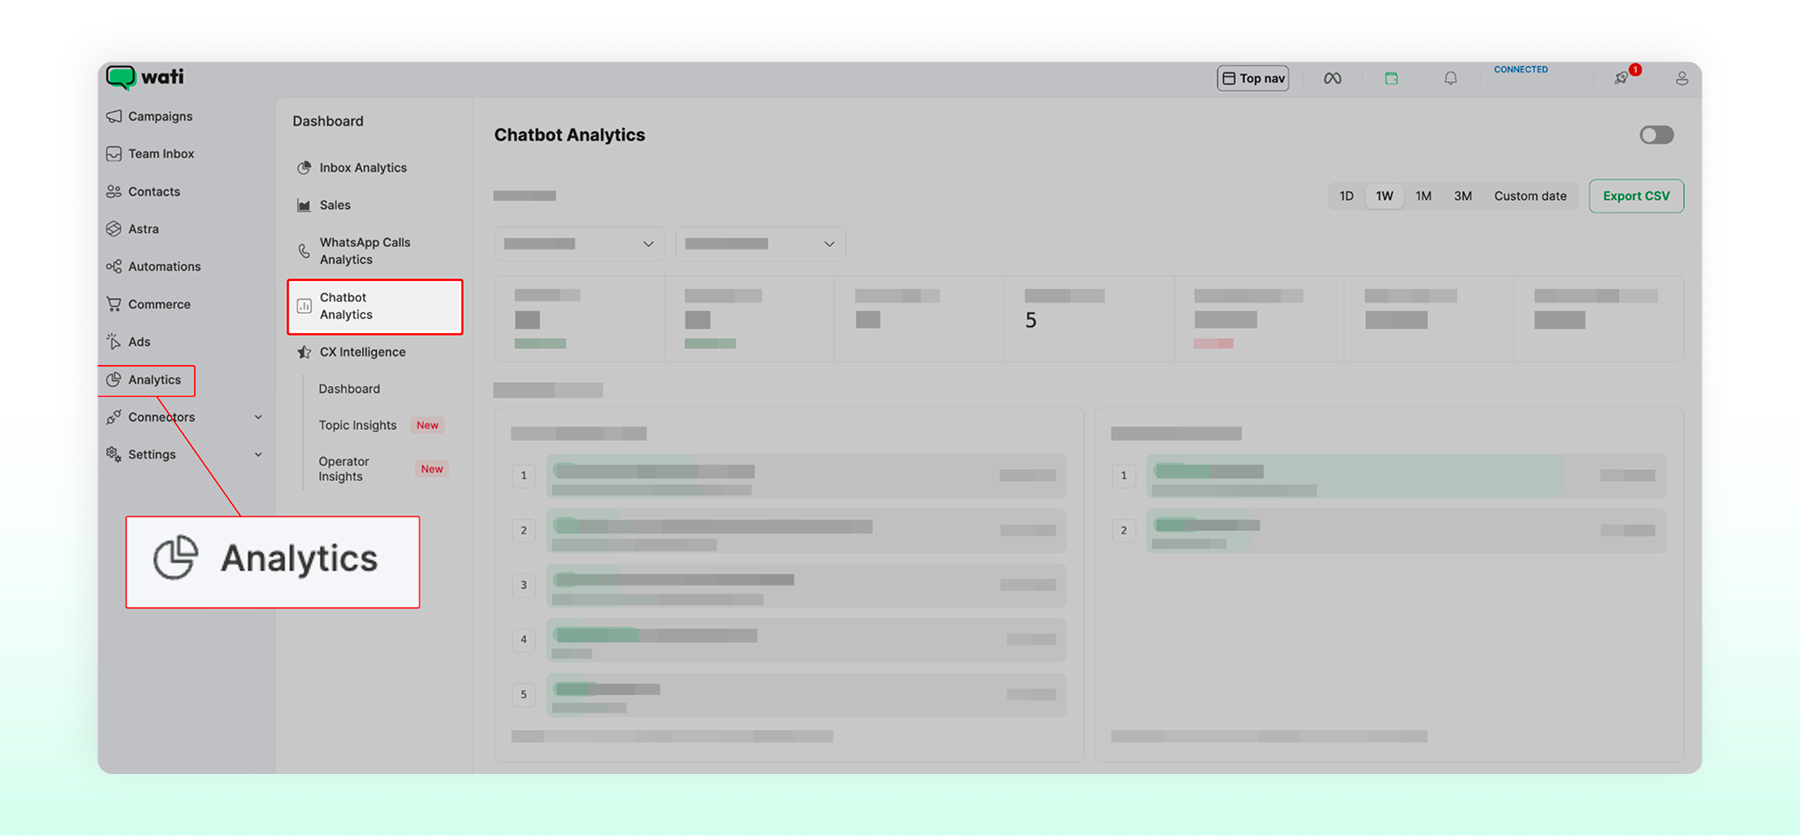
It's a new page under Analytics that replaces that single number with a full performance view across every chatbot on the account. It's built for two groups:
- Business owners who want a high-level view of how their chatbots are performing.
- Automation admins who need to find drop-offs, optimize flows, and troubleshoot individual sessions.
The dashboard shows:
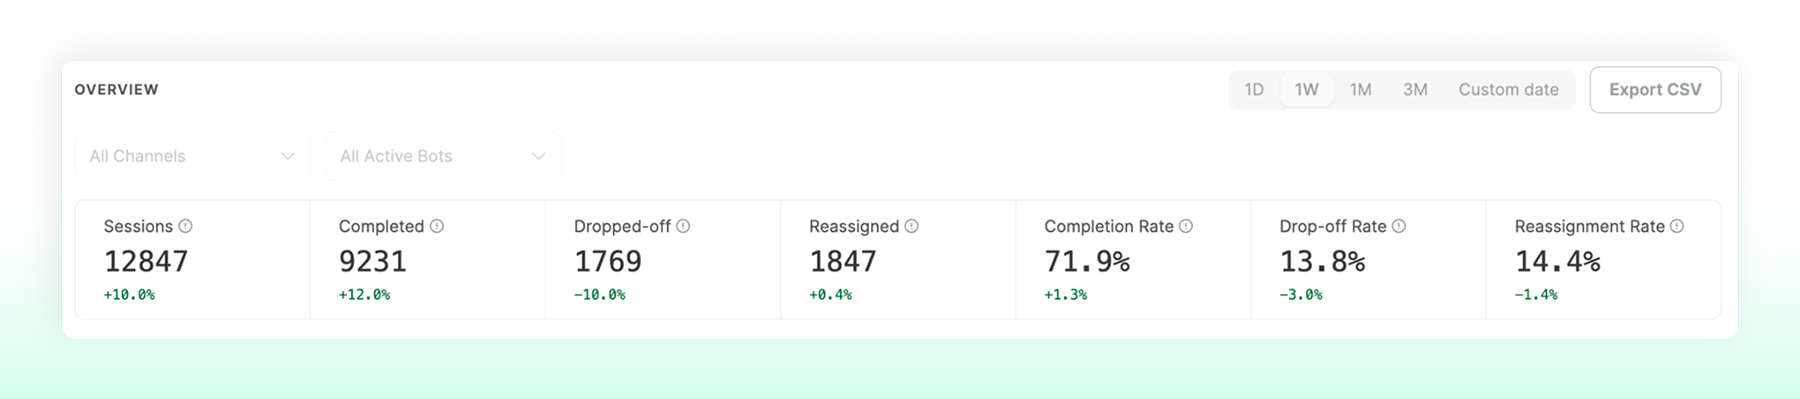
KPI cards for Sessions, Completed, Dropped-off, and Reassigned, plus the completion, drop-off, and reassignment rates calculated from them. These update automatically whenever a filter changes.
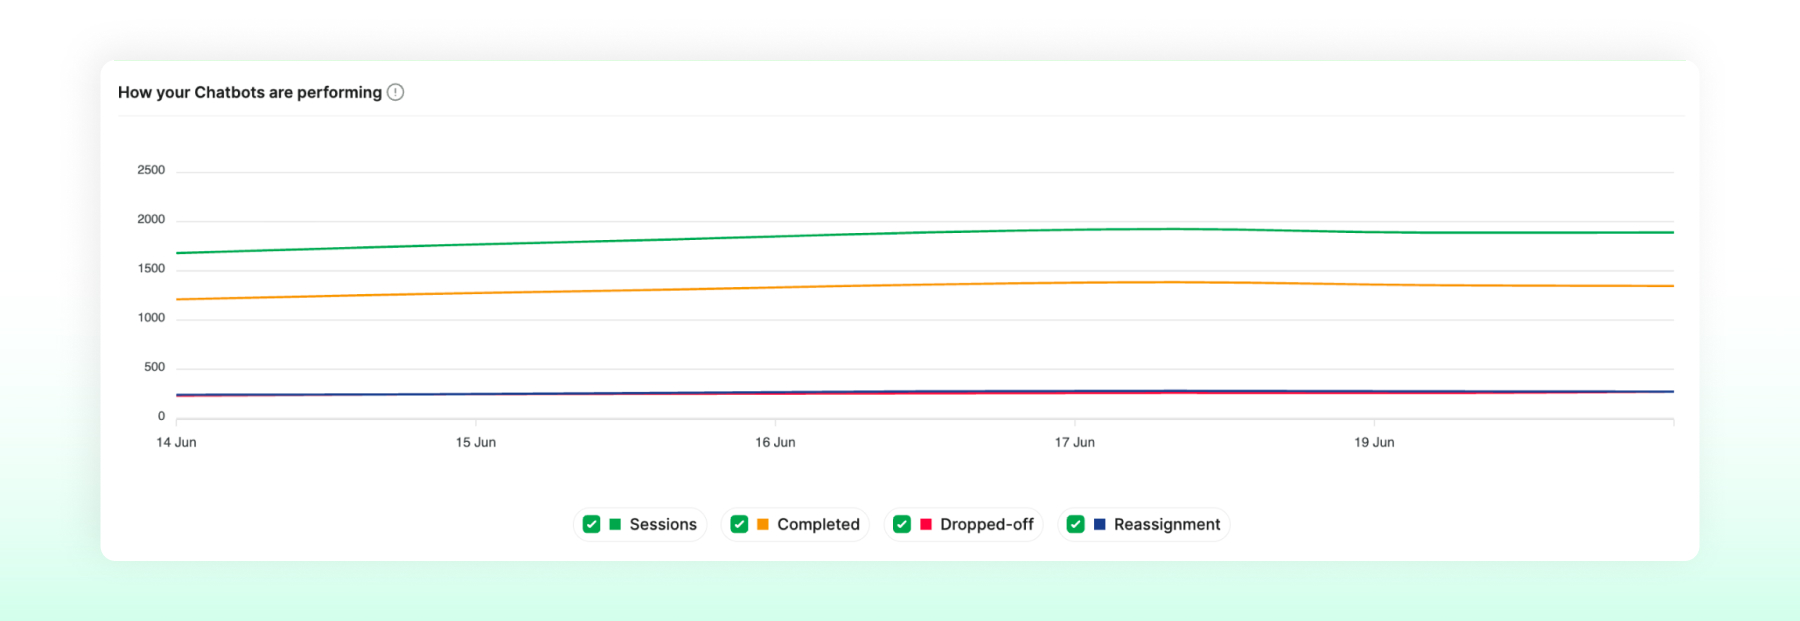
- Trend charts that track session and completion trends over time, monitor completion and reassignment rate trends, and compare chatbots by drop-offs and reassignments, so a team can see whether a bot is getting better or worse, not just where it stands today.
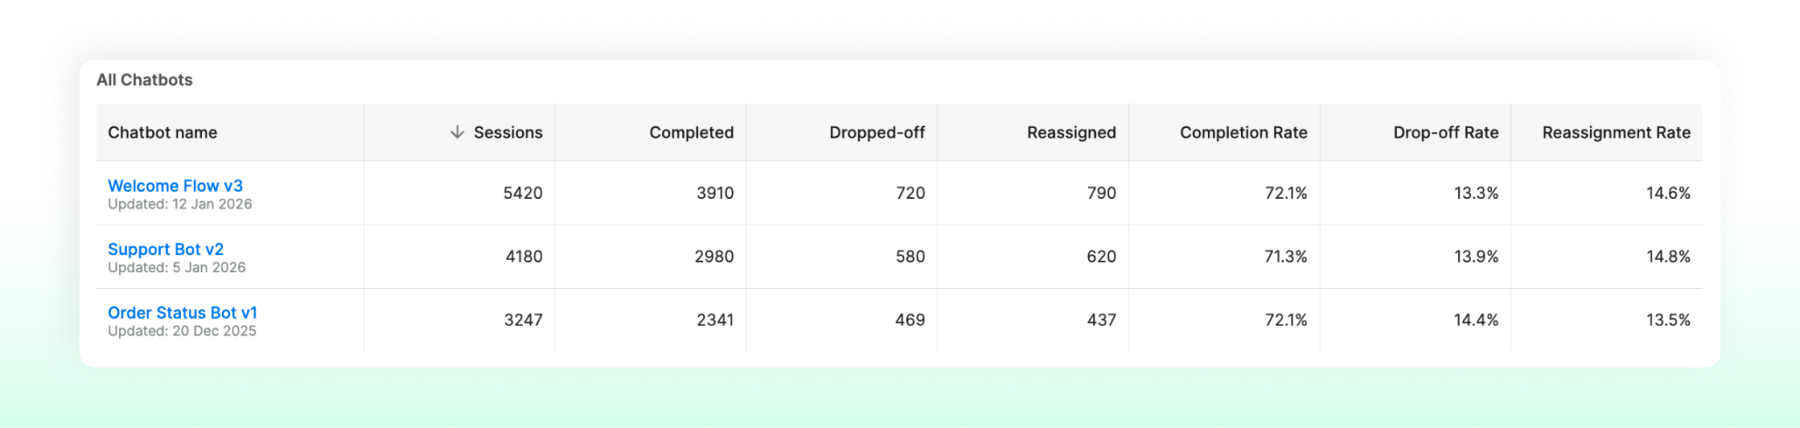
- A comparison table that lines up every chatbot on the account side by side, instead of opening one bot at a time to check its numbers. The comparison table only appears when viewing all chatbots. Select a single chatbot and the table narrows to that chatbot's own performance instead.
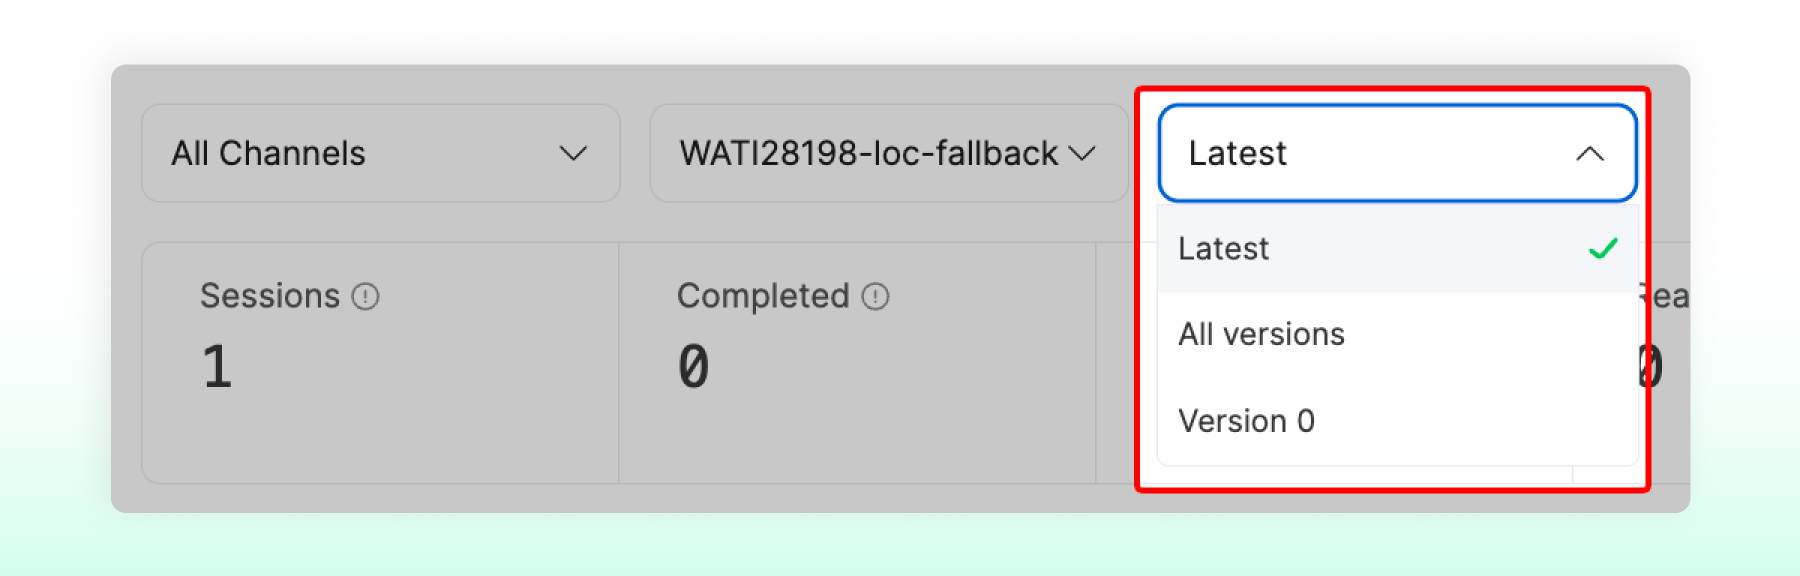
- Filters for date range (last 7 days, last 30 days, last 90 days, or a custom range up to 180 days), chatbot, channel, and chatbot version. The version filter only becomes available once a single chatbot is selected. When viewing all chatbots together, analytics are calculated using the latest published version of each one.
- The "Where to Focus" panel ranks a chatbot's own nodes by drop-off and reassignment count. It's the fastest way into "which node needs attention" from the dashboard itself.
Why this matters:
For business owners: One page answers "is my automation actually working" for the whole account, without needing to open the Flow Builder or ask an admin to pull numbers.
- For automation admins: The side-by-side comparison table surfaces which bot needs attention first across an account running several chatbots, instead of checking each one individually.
- For measuring fixes: Because every chatbot save creates a version, the dashboard can be filtered to one specific published version, so a before-and-after comparison is against the exact version that had the problem, not a blended average that mixes the old flow with the new one.
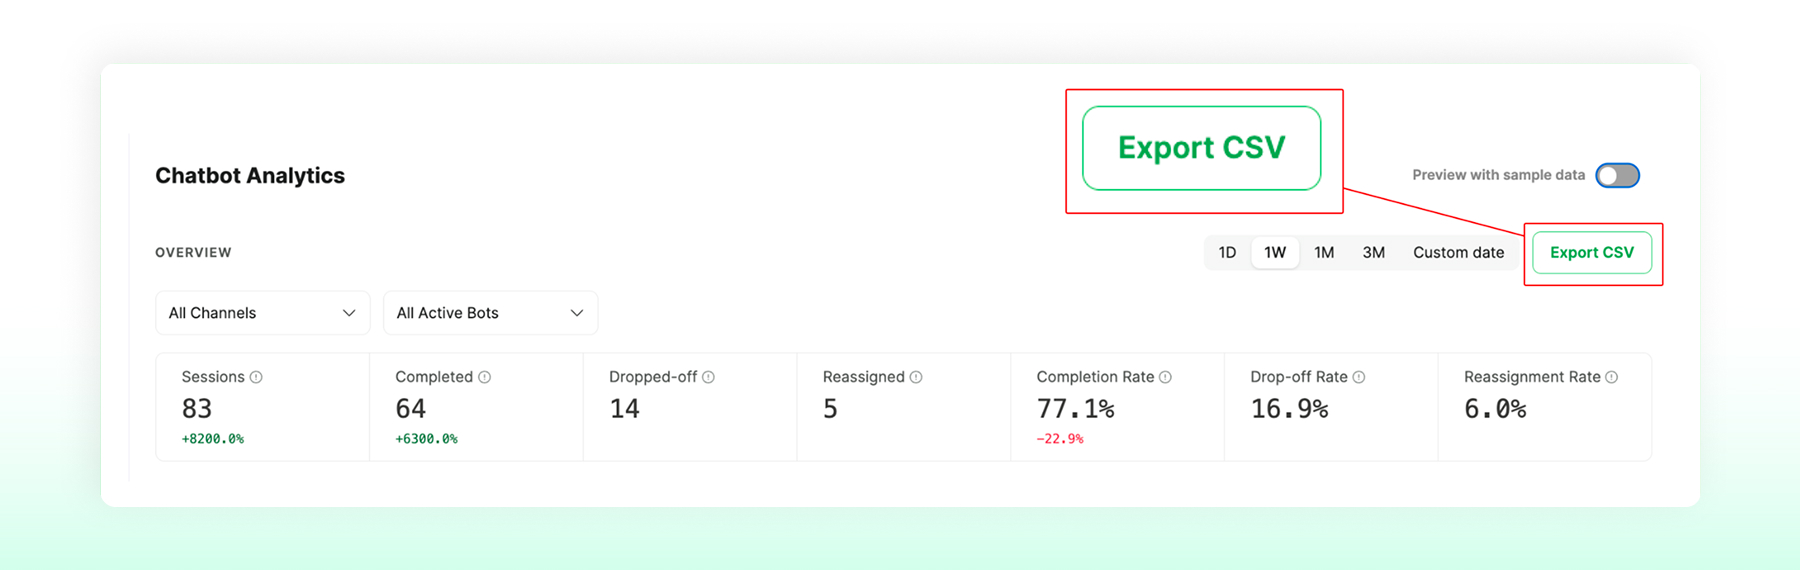
For reporting: The same view a business owner checks casually is also what an admin exports (as a CSV, on the Business plan) to bring numbers into a broader report, rather than maintaining a separate spreadsheet.
With the Chatbot Analytics dashboard as the entry point, the next sections cover how drop-off rate is defined and calculated, how to locate the exact node losing contacts, how to diagnose a single session, and how to fix the leak once it's found.
What is a Chatbot Drop-Off Rate? (Definitions and Formulas)
Chatbot drop-off rate is the percentage of chatbot sessions that end before the contact reaches the flow's final step, calculated as dropped-off sessions divided by total sessions.
Four metrics define chatbot performance, and each answers a different question:
- Sessions: The total number of times a contact entered a given chatbot flow in the selected period.
- Completed: Sessions where the contact reached the end of the flow as designed, including sessions routed to another chatbot or to an AI agent as part of that designed flow.
- Dropped-off: Sessions where the contact stopped responding, timed out, or a technical failure prevented the flow from progressing.
- Reassigned: Sessions where the flow handed the contact to a human agent via an Assign User or Assign Team node, before the automated flow completed on its own.
- In Progress: Sessions that are still active and waiting for the contact to respond.
The three rates that matter are derived directly from those counts:
Completion rate = Completed sessions ÷ Total sessions × 100
Drop-off rate = Dropped-off sessions ÷ Total sessions × 100
Reassignment rate = Reassigned sessions ÷ Total sessions × 100
Say a WhatsApp order-tracking bot ran 1,000 sessions in a week, with 640 completed, 260 dropped off, and 100 reassigned to a human agent. That flow has a 64% completion rate, a 26% drop-off rate, and a 10% reassignment rate. Those three numbers alone tell a business owner whether the automation is carrying its weight, but they don't yet say where the 26% is dropping off. That requires looking inside the flow itself. |
How to Find Exactly Which Step is Losing Contacts
Knowing the overall drop-off rate tells you that a leak exists.
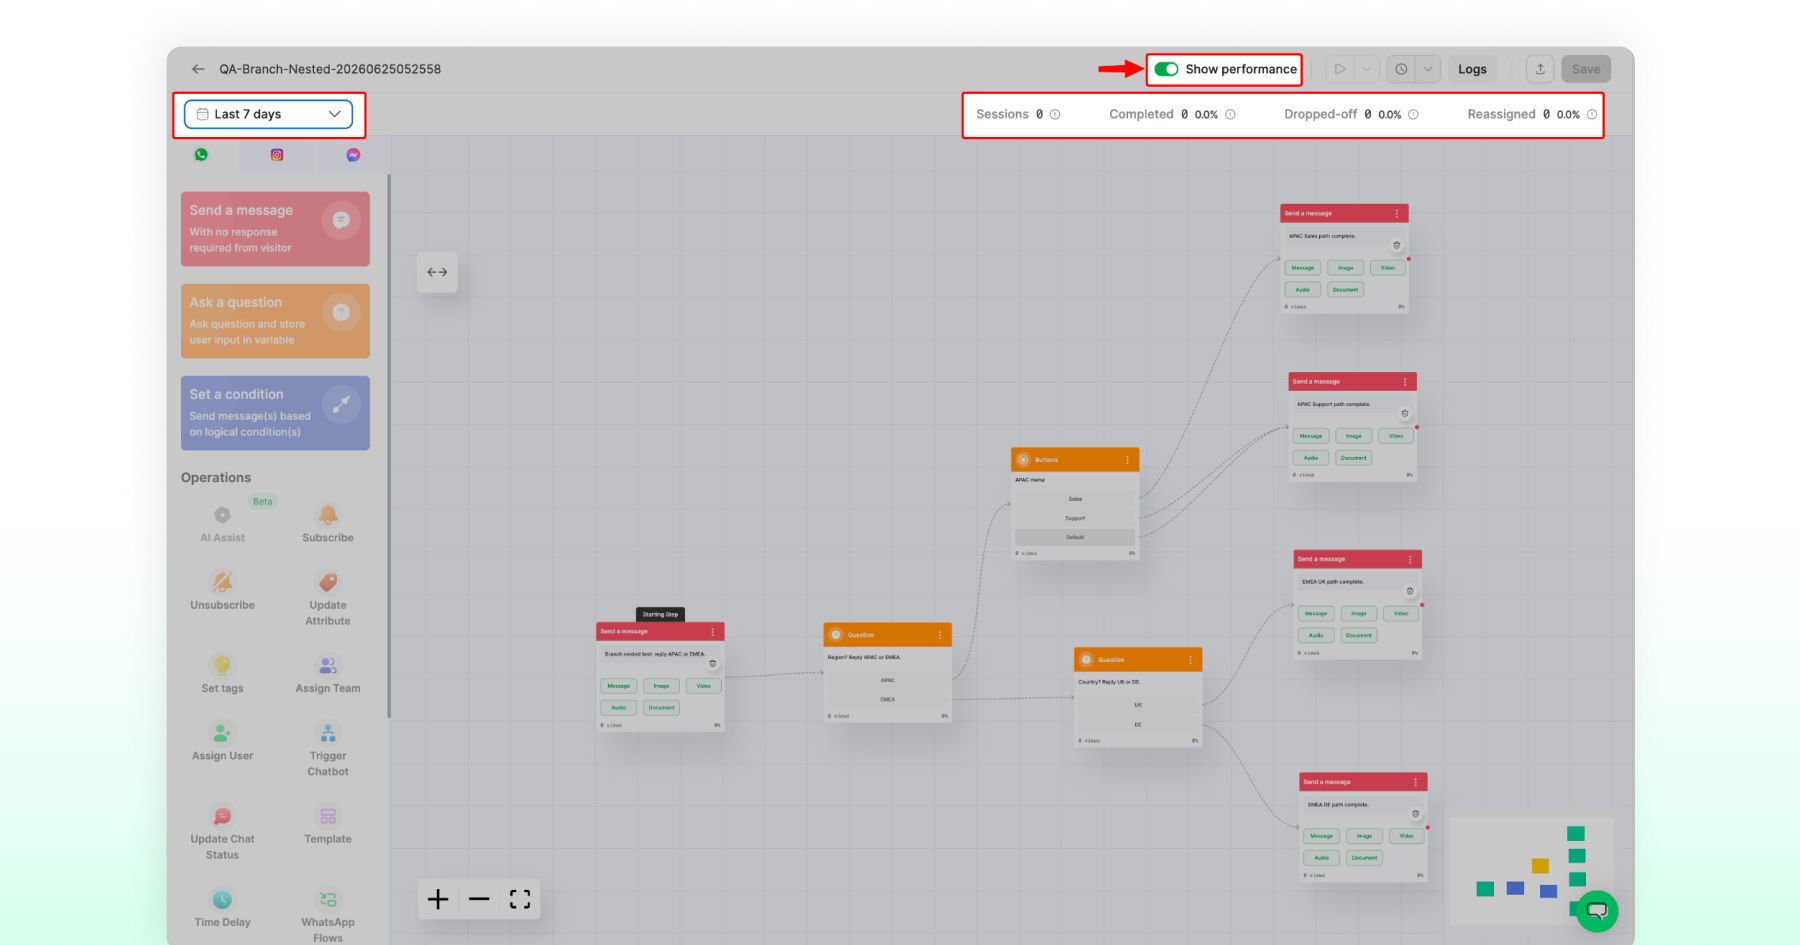
Finding the leak means going node by node inside the flow itself, using Wati's User Journey view. Inside the Flow Builder, a "Show performance" toggle overlays real session data directly onto the chatbot's own nodes.
Session counts and completion percentages appear on each step, and for condition, button, and list nodes, the overlay also shows how sessions are split across each branch.
The toggle only works on published chatbots that already have at least one recorded session; it stays disabled on drafts. The Flow Builder becomes read-only while the toggle is active, so the view reflects exactly what's live, not a draft in progress.
This turns a debugging exercise that used to require guesswork or a support ticket into a direct read of the flow: an admin can see that, say, 40% of sessions branch into a specific button option, then look at what happens to that branch next.
If completion percentages fall off a cliff at one particular node, that node is the leak. No modeling, no exporting data to a spreadsheet. The numbers sit on the dashboard and on the flow diagram itself.
Bonus Read: Customer Journey Analytics - Easiest Analysis Framework
How to Diagnose a Single Broken Session
Aggregate numbers point to the node that's losing contacts. Session Logs show what actually happened in an individual conversation.
Like User Journey, Session Logs only become available once a chatbot is published and has at least one recorded session; draft chatbots have no logs to review.
The "Logs" button inside the Flow Builder opens a side panel listing every session run on that chatbot, with:
- Status: Completed, dropped off, or reassigned
- Contact: Who the session belongs to, including their phone number
- Conversation ID: The specific WhatsApp conversation
- Start time: When the session began
- Last node reached: The exact step where the session ended
- Number of customer-facing nodes traversed: How many steps the session actually passed through
Clicking a conversation ID opens that conversation directly in the Team Inbox.
So an admin can read the actual messages the contact sent and received at the point of drop-off: was the message confusing, did a button fail to render, did the contact ask a question the flow couldn't handle?
Logs can be filtered (for example, to just the dropped-off sessions at a given node) and exported for deeper analysis or reporting.
How to Fix Chatbot Drop-Off Once You've Found the Leak
Finding the leak is half the job. Fixing it follows a repeatable loop.
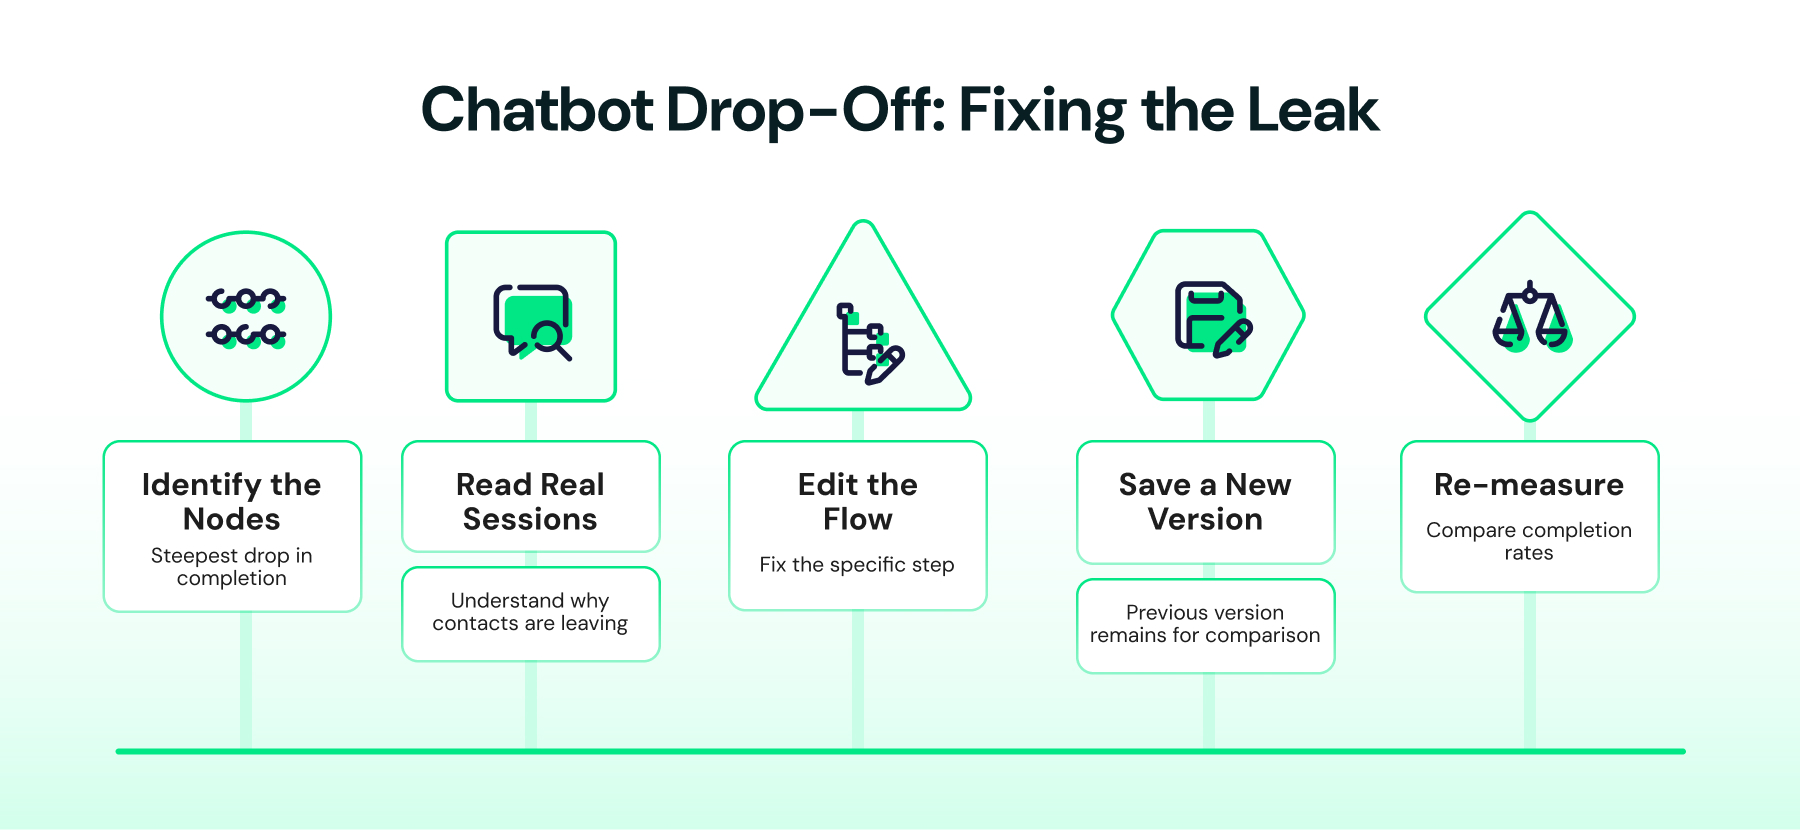
- Identify the node with the steepest drop in completion percentage using the User Journey overlay.
- Read real sessions at that node in Session Logs to understand why contacts are leaving: a confusing prompt, a missing option, a message that doesn't match what the contact expects.
- Edit the flow in the Flow Builder to fix the specific step: rephrase a message, add a missing button option, shorten a form, or add an escalation path for edge cases.
- Save a new version. Every save creates a version, so the previous, leakier version stays available for comparison instead of being overwritten.
- Re-measure. Compare completion and drop-off rates for the new version against the old one at the same node, using the account-wide Chatbot Analytics dashboard and its date-range, chatbot, channel, and version filters.
Because analytics, the User Journey overlay, and Session Logs can all be viewed per published version, this loop is measurable rather than anecdotal.
A team can say, with a specific before-and-after number, whether a flow edit actually reduced drop-off, instead of assuming a rewritten message helped.
What are the Common Mistakes That Drive Up Chatbot Drop-Off?
A few patterns show up repeatedly at the nodes where sessions die:
- Dead-end nodes: A step with no valid next action for a contact whose reply doesn't match any expected button, list option, or keyword.
- Too many steps before value: Long qualification or data-collection sequences before the contact gets to the outcome they came for.
- Ambiguous prompts: Messages that don't make it obvious what to tap or type next, especially on lists and button menus with unclear labels.
- No human fallback: A flow with no reassignment path for contacts who need something the bot can't handle, so they simply stop replying instead of escalating.
- Untested branch logic: Condition nodes where one branch was never actually verified against real contact behavior, only against the happy path.
Each of these is directly visible once a team has node-level completion percentages and can read the real conversations that stalled.
That's the underlying reason for measuring at the node level rather than only at the whole-flow level.
Stop Guessing, Start Measuring
Digital-first channels are only going to carry more weight in customer service, not less. A WhatsApp chatbot that nobody is measuring is exactly the wrong place to be flying blind as that shift accelerates.
Chatbot Analytics turns "I think contacts are dropping off somewhere" into a specific, fixable answer.
Instead of waiting for a support ticket or a hunch that something feels off, a team can open one dashboard, see the account-wide numbers, drop into the exact node that's leaking, read the real conversations that stalled there, and confirm a fix actually worked before calling it done.
If your team hasn't turned this on yet or wants to see the node-level view and Session Logs in action on your own flows, book a Wati demo, and we'll walk through it together.
Frequently asked questions
1. What is the Chatbot Analytics dashboard, and what does it show?
It's a new page under Analytics that shows account-wide KPI cards (Sessions, Completed, Dropped-off, Reassigned, and the rates calculated from them), trend charts, and a table comparing every chatbot side by side, filterable by date range, chatbot, channel, and chatbot version. It replaces the single "total automations executed" number that used to be the only chatbot metric available.
2. Why is my WhatsApp chatbot not working even though it runs without errors?
A bot with no errors can still fail the business if contacts stop responding partway through the flow. "Working" means completing without a technical fault; "effective" means most contacts reach the intended outcome. Chatbot Analytics measures the second thing: sessions, completions, and drop-offs, which a bot running error-free won't show on its own.
3. How do I calculate my chatbot's drop-off rate?
Divide the number of dropped-off sessions by total sessions in a period and multiply by 100. For example, 260 dropped-off sessions out of 1,000 total sessions is a 26% drop-off rate. Wati's Chatbot Analytics dashboard calculates this automatically per chatbot, channel, and date range.
4. What's the difference between a dropped-off session and a reassigned session?
A dropped-off session ends because the contact stopped responding, timed out, or hit a technical failure before finishing the flow. A reassigned session ends because the flow deliberately handed the conversation to a human agent through an Assign User or Assign Team node; the automation is still working as designed in that case.
5. How do I find which step in my flow is causing the most drop-offs?
Turn on "Show performance" in the Flow Builder. The overlay shows session counts and completion percentages directly on each node, including how sessions split across condition, button, and list branches, making the node with the steepest drop visible on the flow diagram itself.
6. Can I see what happened in one specific customer's chatbot session?
Yes. The "Logs" panel in the Flow Builder lists every session with its status, contact, conversation ID, start time, and last node reached. Clicking the conversation ID opens the full conversation in the Team Inbox.
7. Do I need to rebuild my whole flow to fix a drop-off point?
No. Because analytics, User Journey, and Session Logs are all available per version, teams typically fix the single node causing the leak, save a new version, and compare its completion rate against the previous version, without touching the rest of the flow.
Related posts
- How to Use an Instagram Chatbot for FAQ Automation (2026 Guide)
An Instagram chatbot replies to DMs, comments, and story replies instantly using keyword triggers, then hands off to a human when needed. Here's how to set one up in Wati.
- How to Capture Phone Numbers From Instagram DMs With Wati in 2026
An Instagram DM lead capture flow collects a prospect's phone number, then bridges the chat to WhatsApp. Set it up in Wati, step by step.
- How to Set Up Keyword-Triggered Instagram Automation in Wati
Keyword-triggered Instagram automation sends an auto-DM only when a comment matches your keyword. Set it up in Wati in under 10 minutes.
- How to Set Up Wati Instagram DM Automation for Comments in 2026
Wati Instagram DM automation sends an auto-DM to every commenter on your posts or reels. Connect Instagram, build a flow, set the trigger, and test.